In 2021, President Joe Biden created the Justice40 Initiative, which directs at least 40 percent of federal investments in climate, energy, transit, workforce, infrastructure, and environment-related programs to “disadvantaged communities.” The benefits are far-reaching and range from reduced air pollution and greenhouse gas emissions, lower energy burdens (the share households spend on electric and other energy bills), improved public transportation, and the creation of clean energy jobs and training opportunities, among others.
The Justice40 Initiative covers hundreds of federal programs that receive billions of dollars every year. Over the next couple years, the federal government will dole out historic investments under two new laws: the Bipartisan Infrastructure Law and the Inflation Reduction Act, which together allocate close to $2 trillion to combat climate change, provide affordable and sustainable housing, and improve the nation’s aging infrastructure.
If the Justice40 Initiative is to be successful, then at least 40 percent of these investments must flow to disadvantaged communities. To identify these communities, the White House Council on Environmental Quality (CEQ) recently launched the Climate and Economic Justice Screening Tool (CEJST), a geospatial mapping tool that uses various datasets to reflect indicators of socioeconomic and environmental burdens across the country.
Under the tool, a community, or census tract, will be considered disadvantaged if it exceeds the thresholds for one or more environmental burden or climate indicators and for corresponding socioeconomic indicators. The tool, however, does not use racial demographic data as an indicator, going against the wishes of organizations and advocates that fight for environmental justice. More than 27,250 communities are considered disadvantaged or partially disadvantaged under the latest version of the tool.
Unlike state environmental justice screening tools, CEJST datasets are shared and available across all U.S. states and territories. Version 1.0 is much stronger than the tool’s beta version, in part because CEQ incorporated many of the recommendations we and other social and climate justice groups made in May in a joint comment letter to the agency.
For instance, the tool now includes nine new datasets to indicate environmental or climate burden; identifies lands within the boundaries of federally recognized tribes as disadvantaged; and is easier for the public to use.
Tool Risks Overlooking Some Communities
And yet: While the tool provides a consistent data-based definition of disadvantaged communities, it does so at the risk of leaving out certain communities that are considered underserved and overburdened according to state-based tools and datasets — but not under CEJST. It also risks leaving out disadvantaged communities, especially rural communities, whose burdens may not be captured by any existing dataset or tool.
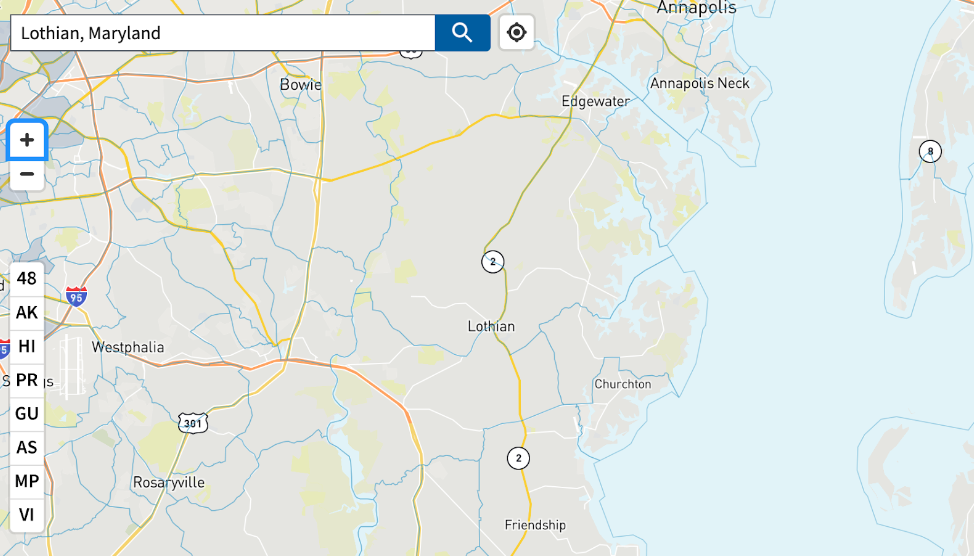
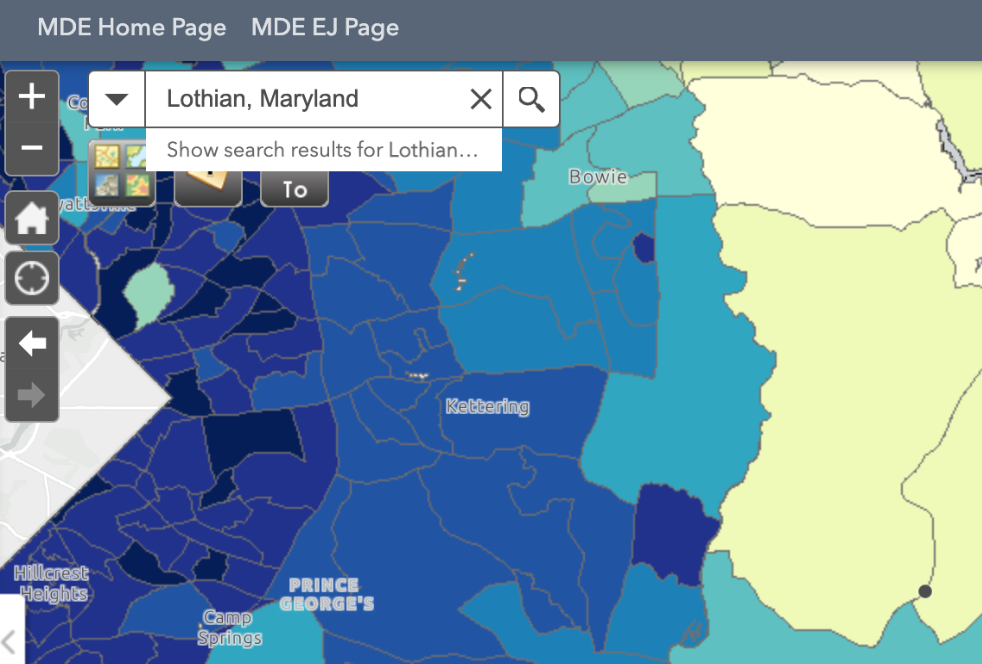
For example, the CEJST tool does not identify some rural communities in Lothian, Maryland, even though they face disproportionate environmental and health burdens from local mining and waste disposal operations. Maryland’s state-based environmental justice screening tool more accurately reflects the area’s burdens, scoring it in the top 16 percent of the state for environmental justice concerns.


Challenges Facing Fenceline Communities
On the other side of the country, rural and tribal communities in California face barriers to being designated as disadvantaged in CalEnviroScreen, first developed in 2013 (and on which the CEJST is modeled). Since then, the California Office of Environmental and Health Hazard Assessment has updated the tool several times, with CalEnvrioScreen 4.0 being the most recent version. These updates have improved the tool, but some shortcomings remain.
In recent years, CalEnviroScreen has added datasets and included adjustments to emissions estimates to more accurately account for disproportionate environmental and health impacts. Although the tool does not include indicators for race or ethnicity, the California Environmental Protection Agency (CalEPA) has acknowledged the role of racism in land use planning in the state.
Even with this acknowledgement, it has been a challenge to effectively identify underserved communities near polluting facilities, which are often adjacent to wealthy communities.
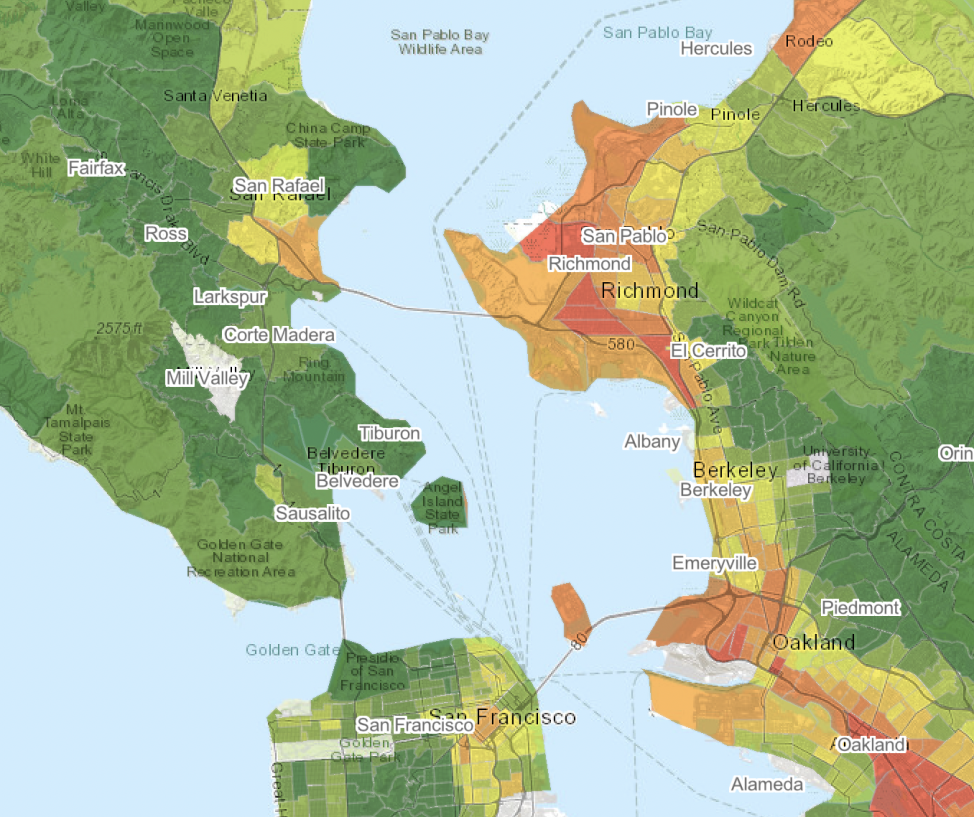
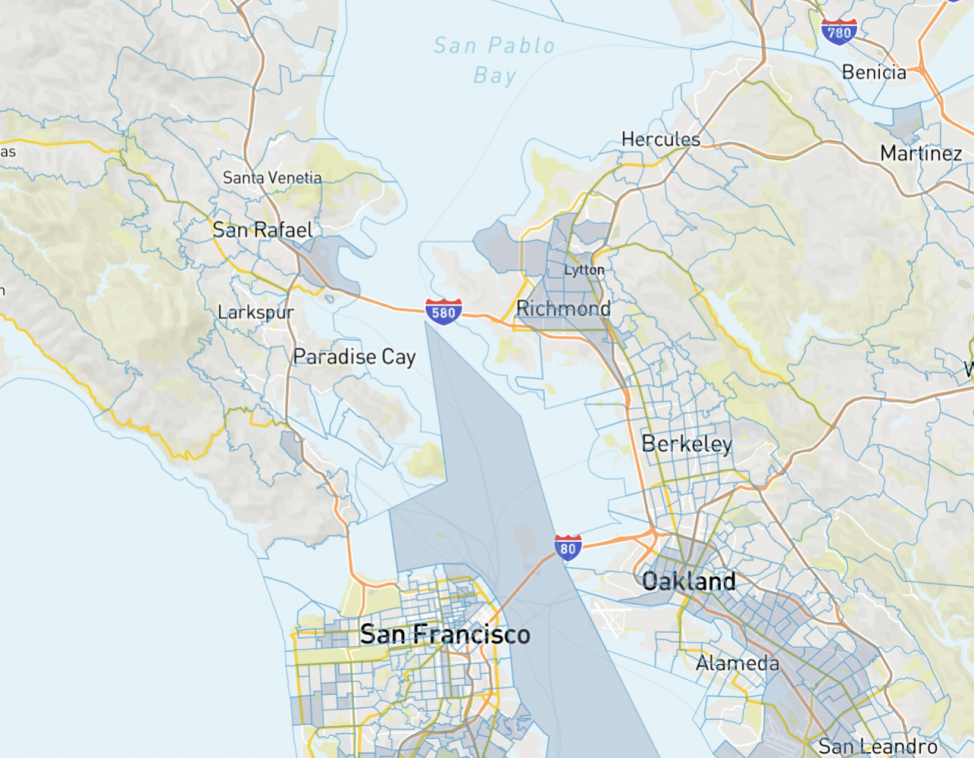
For example, fenceline communities, such as Richmond, California, and surrounding Bay Area communities still often lack local air quality monitoring data to document the harms of industrial pollution and demonstrate disparities across communities. The region is home to the state’s largest petroleum refinery, a significant number of chemical and industrial manufacturers, a regional solid waste facility, two interstate highways, and a major port — but is also adjacent to San Francisco and other affluent communities.
Using CalEnviroScreen, most — but not all — fenceline communities in the region are designated as disadvantaged. Under the CEJST, many more overburdened communities are left out.

Note: Dark red areas of the map represent communities most sensitive to pollution, and dark green areas are communities least sensitive to pollution.)

California law requires the state’s cap-and-trade program to allocate at least 25 percent of funds to disadvantaged communities. However, deep gaps remain between the capacity and resources of historically affluent communities and historically underserved communities, especially when applying to and participating in complex, competitive grant funding programs.
Improvements to Federal Screening Tool Needed
Unlike CalEnviroScreen, which combines 21 indicators for pollution exposure, environmental effects, socioeconomic factors, and sensitive populations to determine communities with the most cumulative burden in the state, CEJST does not consider cumulative impacts (the total effects of past, present, and future actions, pollution, and environmental exposures) and instead weighs indicators for each of the eight categories separately. As a result, federal agencies are designing funding programs that focus on separate categories and target isolated indicators.
CEQ notes that CEJST will be updated annually, with continuous opportunities for the public to provide feedback and “ground-truth” the tool. As the tool improves, federal agencies must defer to state and local governments because they know their communities best.
Datasets, while incredibly useful, are imperfect and sometimes fail to reflect the everyday realities that communities face. For the Justice40 Initiative to be successful, state and local governments should meaningfully engage with overburdened and underserved communities about their needs while aggressively pursuing the federal funding opportunities available to meet those needs.
While resources are available, state and local governments may need to staff up and rethink their methods of public engagement. Together, we need to hold the federal government accountable to its pledge on environmental and economic justice — and ensure it directs resources to those that need them most.

