
| Quick resources |
| Explore the 2024 Communities Left Behind report |
In early 2024, the Center for Progressive Reform published a comprehensive analysis on local restrictions to building renewable energy and their intersection with concerns regarding climate justice and democracy. In Communities Left Behind, we found local energy restrictions were a critical piece in preventing the clean energy transition from reaching hundreds of communities where the economic development opportunities it offers could be most beneficial.
Since then, a lot has changed. The passage of the Inflation Reduction Act, or IRA (via tax credits, direct pay for communities, as well as programs such as “Empowering Rural America” and “Solar for All”), meant a lot more available funding for developing clean energy infrastructure, alongside political, economic, and social dynamics — including opposition from communities — that are part of the energy transition. The second election of President Donald Trump, with a clear anti-renewable and pro-fossil fuel agenda outlined in his own stated policy positions, as well as in Project 2025, introduced even more uncertainty to the system, empowering local anti-renewable interests in their efforts to oppose renewable siting.
This push and pull of anti- and pro-renewable interests in the past two-and-a-half years has not resulted in a stalemate. On the contrary, we have seen a troubling increase in the number of counties across the country that have taken steps toward restricting renewables, creating a complex picture in a national context where clean energy development is under siege. Our previous analysis captured the ordinance landscape circa May 2023, and this update is meant to close the data gap between that date and January 2026, which is when we finished coding this new batch of ordinances (see the methodological notes at the end of this article).
This update, however, goes beyond merely closing a temporal gap. Our recent survey helped uncover a small number of ordinances that predate our first report but that we were unable to include. Their inclusion here, along with the more recently enacted ordinances, yields a much more comprehensive database.
Our interactive map also reflects these changes, and it provides an intuitive interface for searching individual counties, as well as easy access to the underlying data, including specifics about each renewable ordinance in place.
What has changed since our report came out? We summarize our main findings below, paying special attention to those states where we have seen the biggest changes.
Where have we seen the biggest changes?
According to our latest research findings, 975 counties across the continental United States now have some form of wind or solar restrictions in place. This is a significant increase from the end of 2023, when a total of 797 counties had instituted restrictive wind and solar ordinances. This represents a 22.3% increase in the number of counties that have passed (and in rare cases, updated) restrictive renewable ordinances during the intervening period between our analyses.
As the plots below show, these changes are not evenly distributed in terms of technology (solar vs. wind) or geographies.
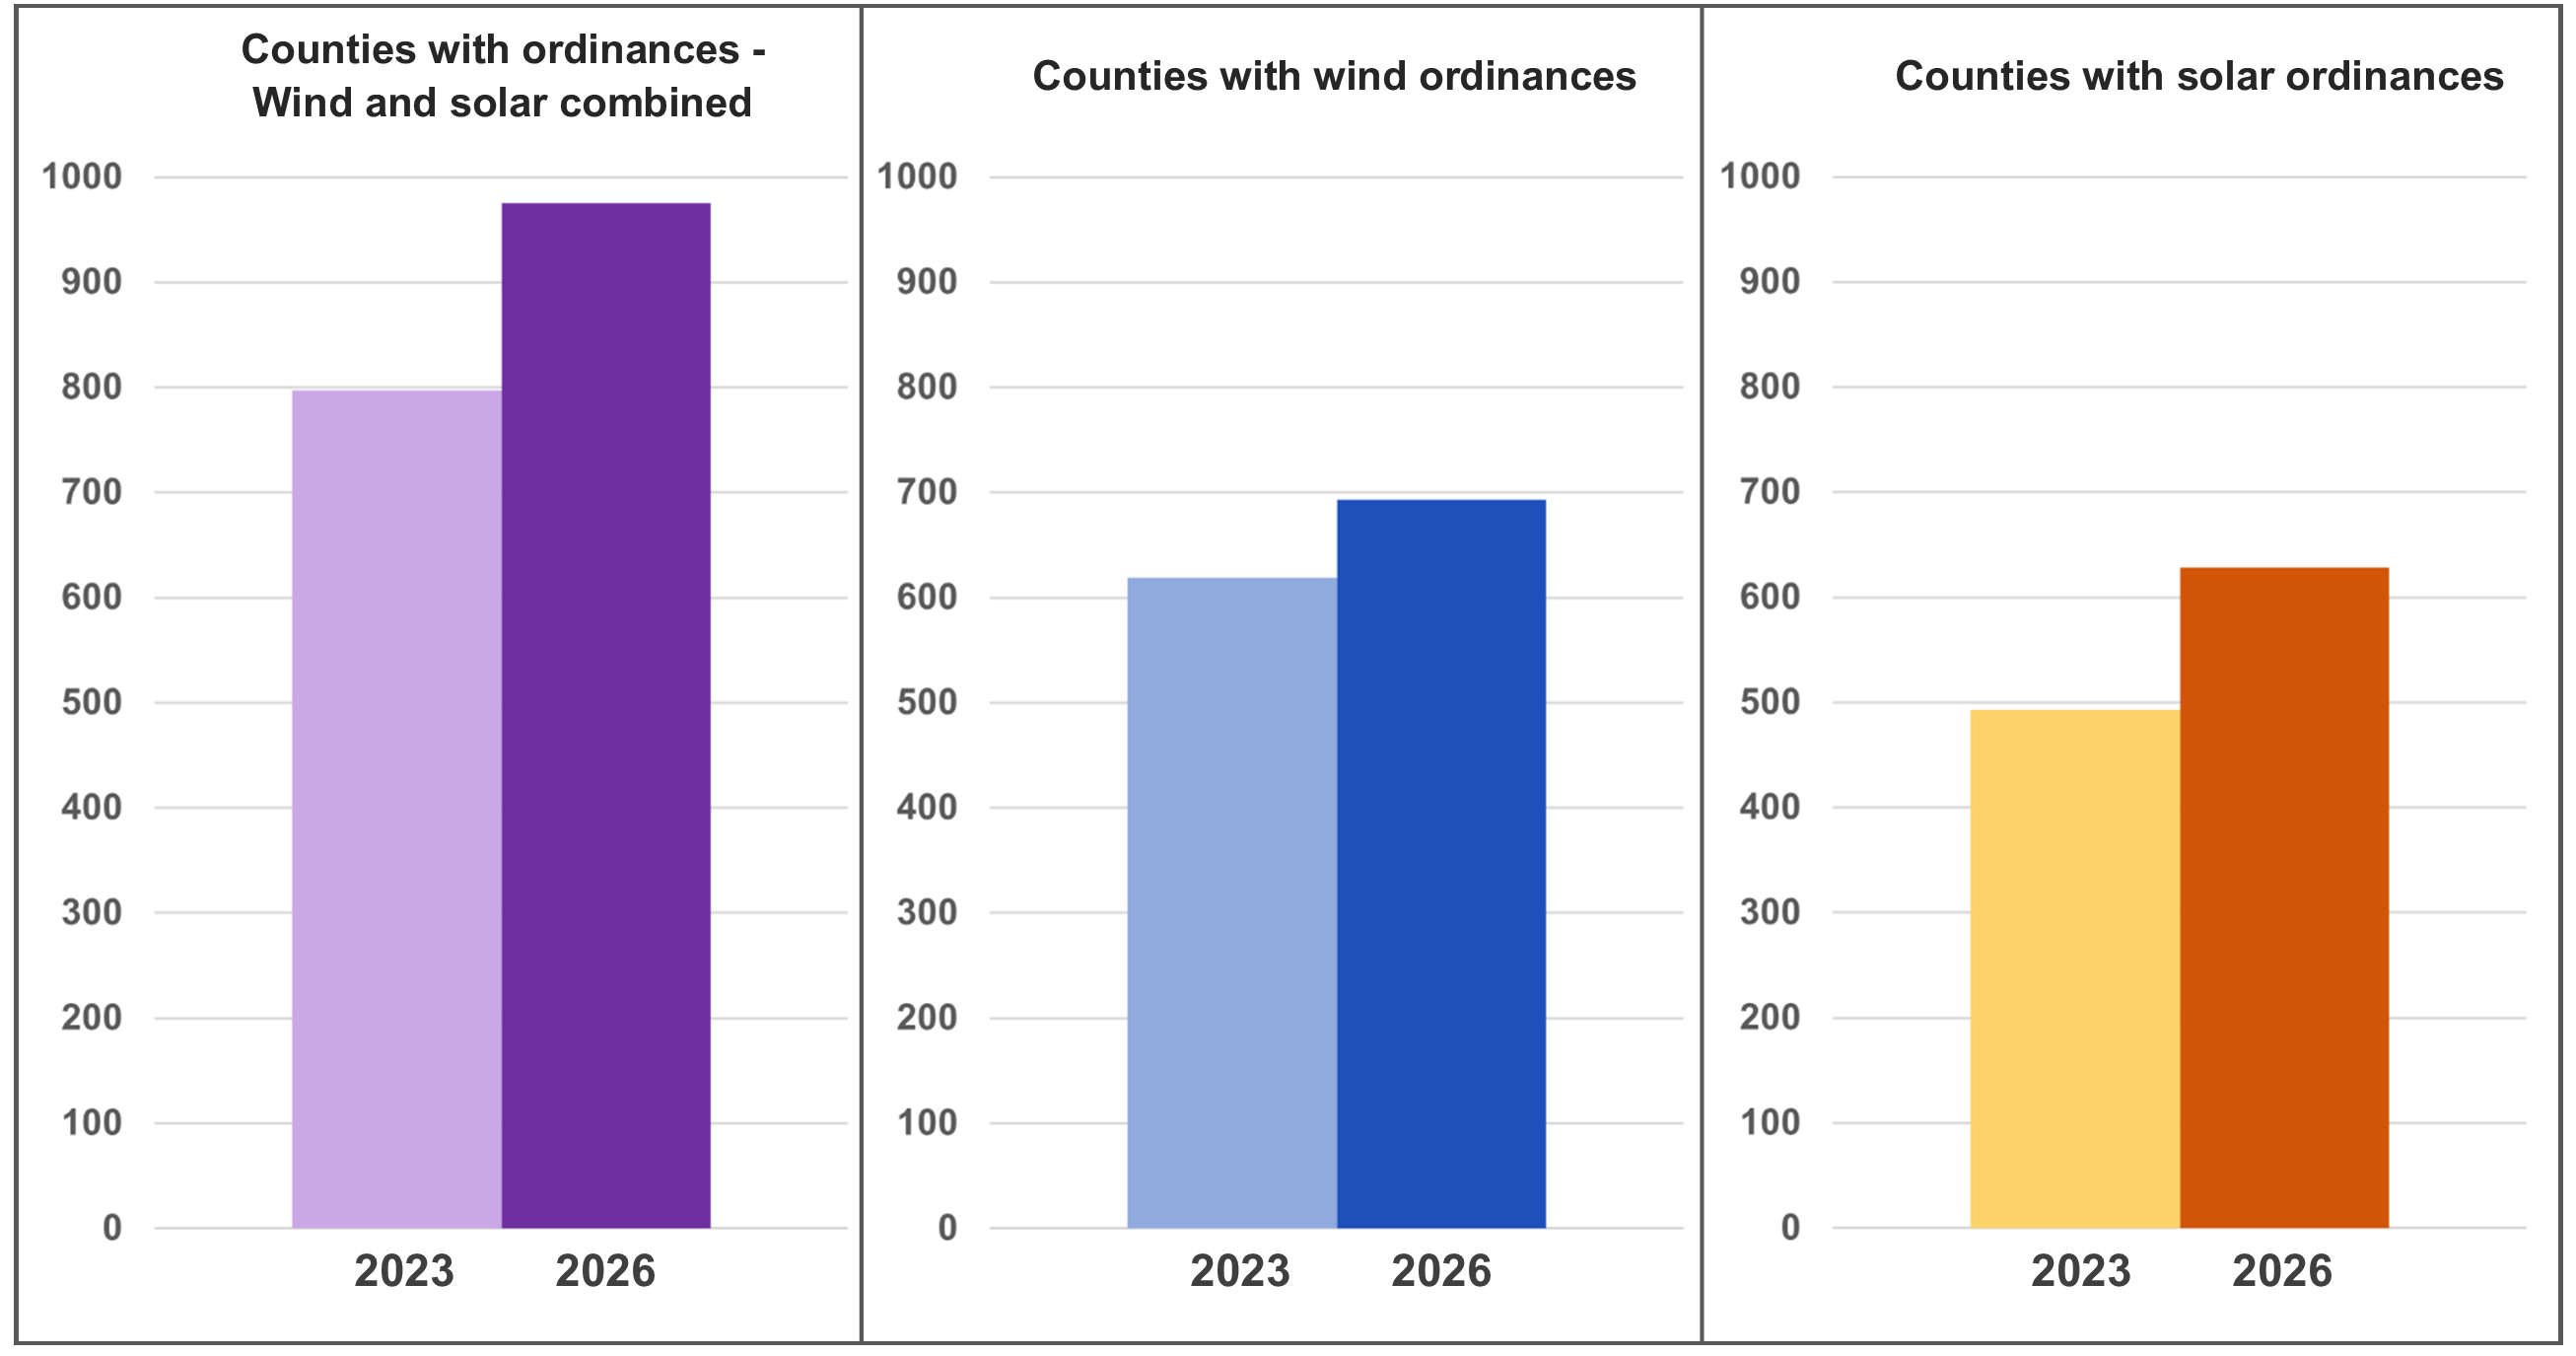
When it comes to wind ordinances, we identified 693 counties with restrictive wind ordinances in place, 74 of which were passed after 2023. This represents an increase of almost 12 percent (11.9%) compared to 2023. We also identified a total of 628 counties with restrictive solar ordinances, 135 of which were passed after 2023. This represents more than a 27 percent (27.4%) increase compared to 2023.
These figures confirm underlying trends (particularly as they relate to solar restrictions) that threaten the ability of many communities to participate in a just transition to an inclusive, clean energy economy. Crucially, many of these counties are located in primarily rural areas that are becoming increasingly vulnerable to climate-related risks, putting many landowners in a tough situation that could be mitigated by diversifying their revenue stream in the form of solar or wind farms, or by leasing part of their land for renewables siting. Some of these areas have struggled to attract new industries to rebuild their tax bases and provide good employment opportunities for their citizens. These ordinances foreclose renewable energy generation as a viable solution.
What does the current landscape look like?
Those who read our 2024 report will find the next map familiar: it shows those counties with a “ROMO” (Risk of Missing Out) index value. Our ROMO index is a weighted overlay of several variables, including the number of restrictions in a given county, the number of contested renewable projects, and socioeconomic and energy burden data (for a detailed explanation of our definitions and methodology, please see the original report).
The map helps visualize the broad distribution of the anti-renewable energy ordinances across the country, as well as their potential negative socioeconomic impacts. The darker areas represent higher ROMO index values, highlighting those counties that may benefit the most from the very renewable energy projects that their ordinances restrict or prevent.
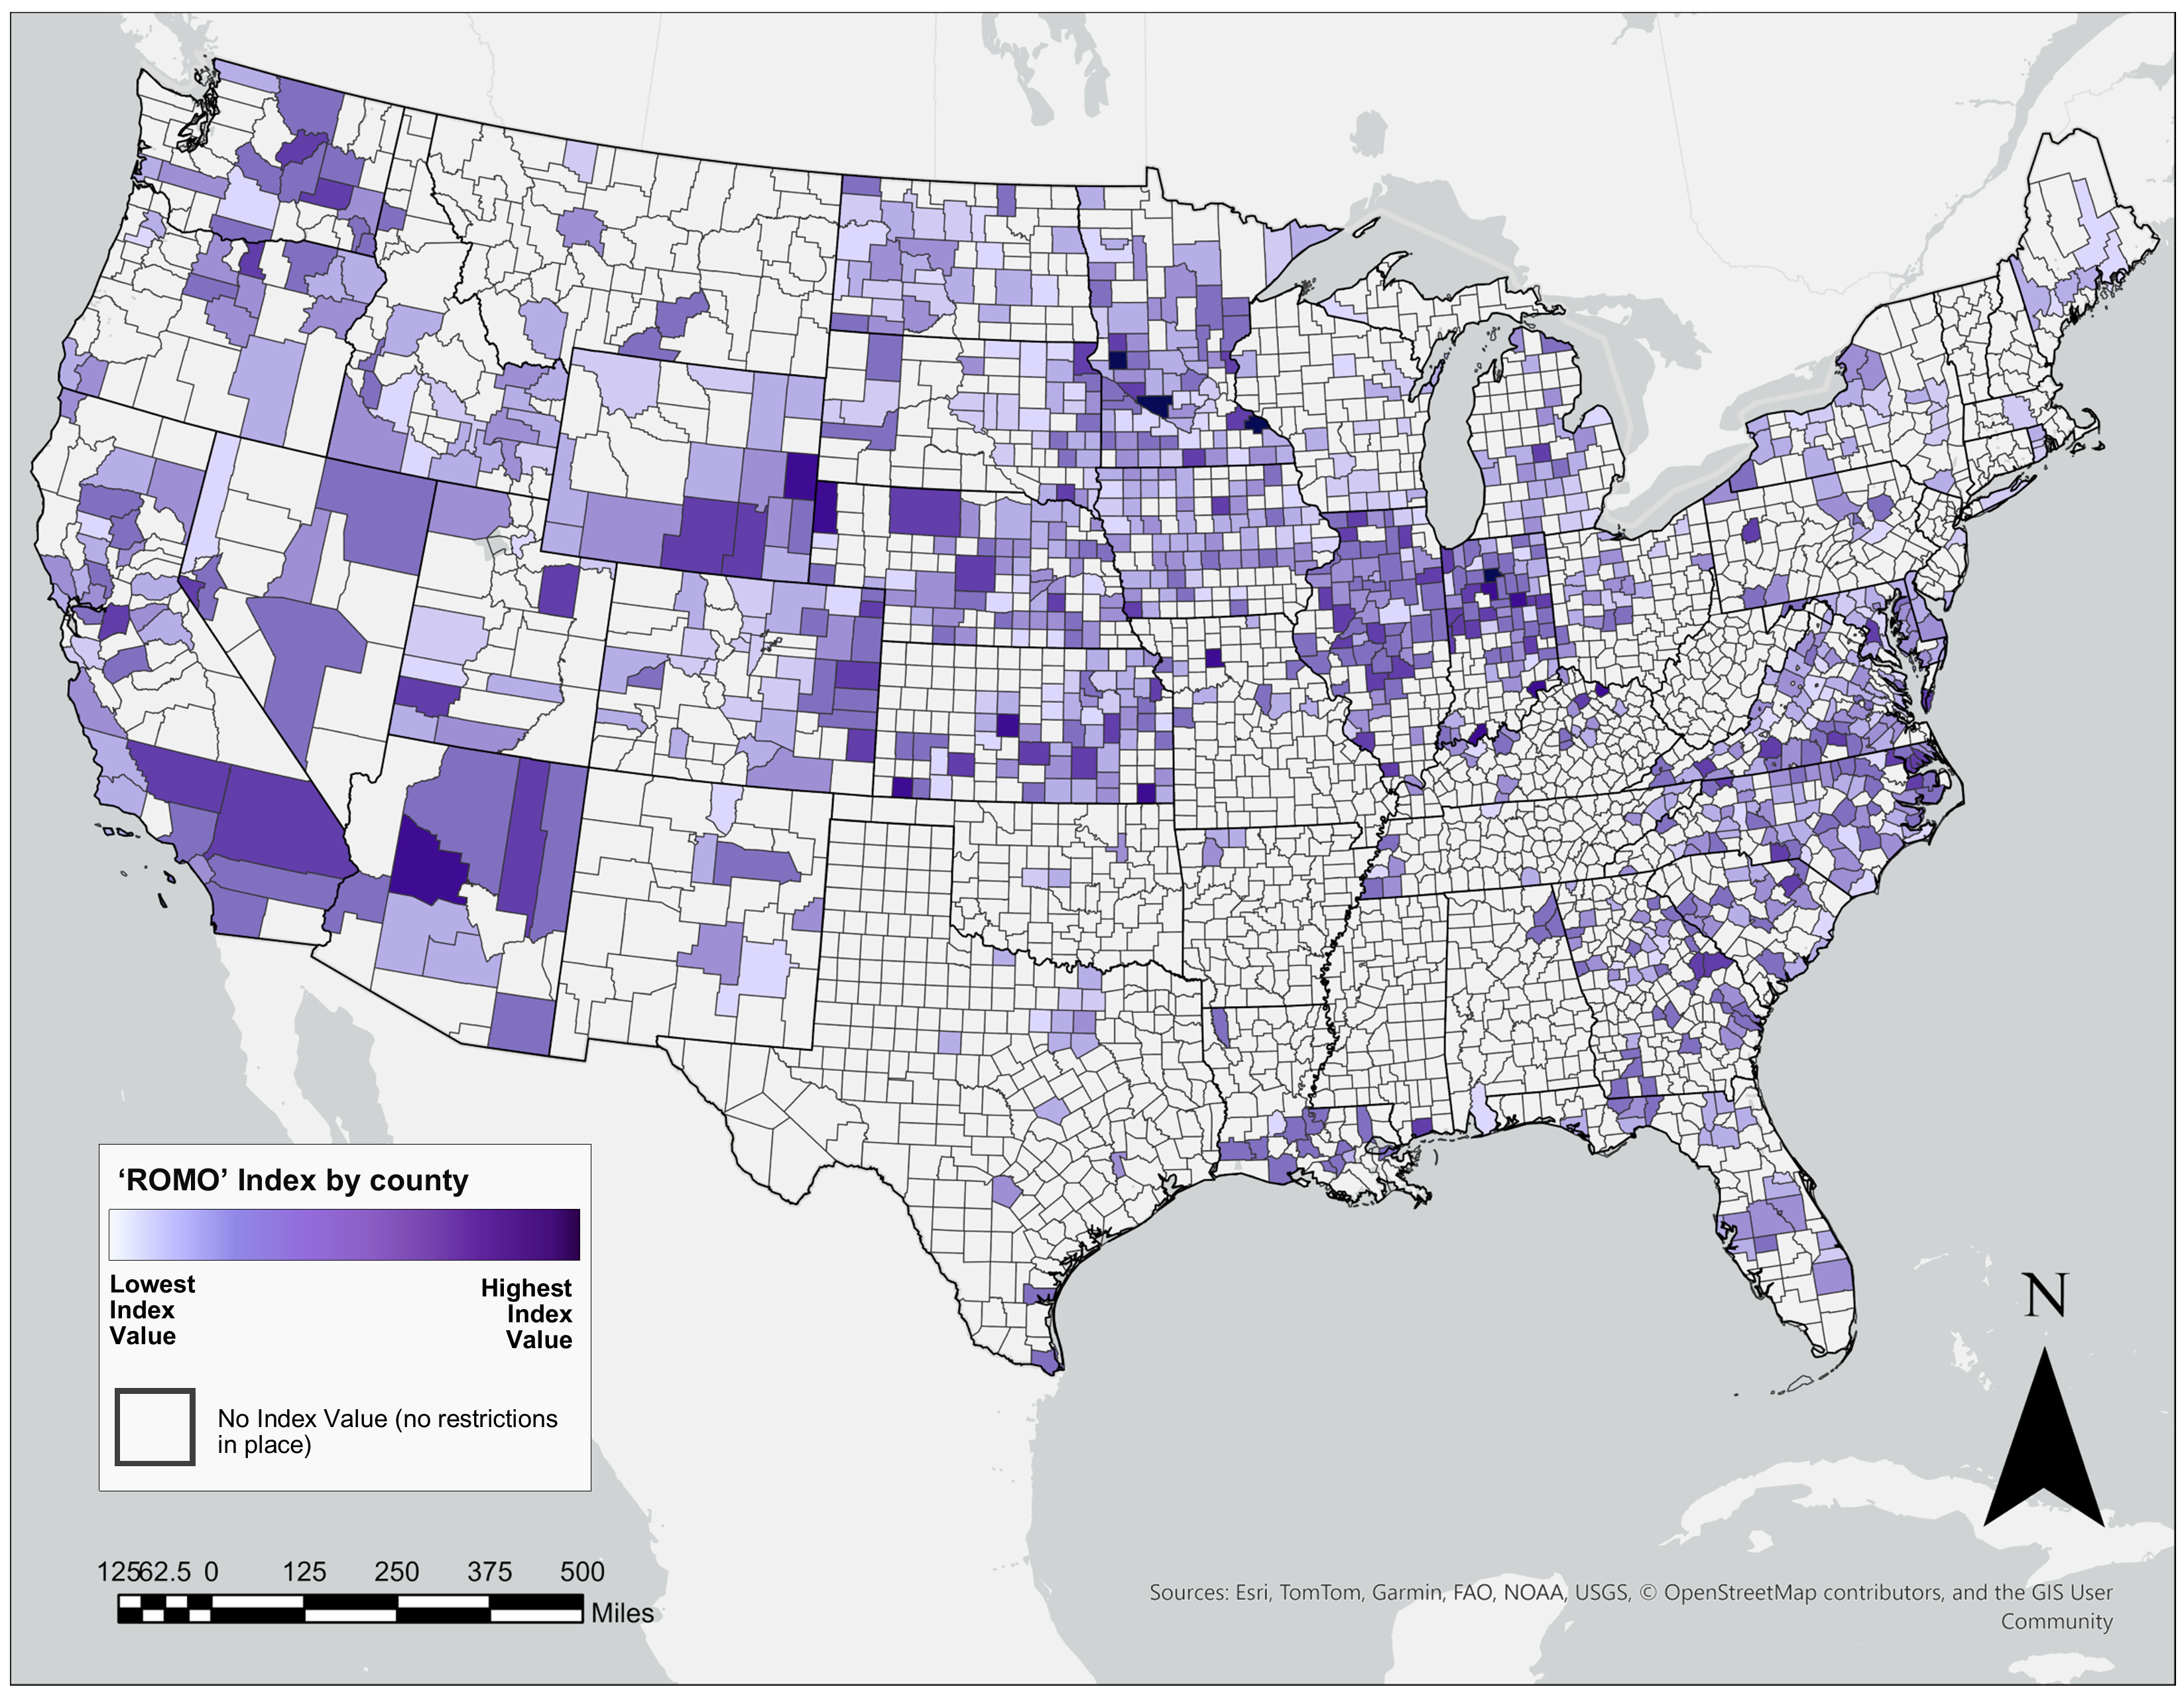
Click map to enlarge
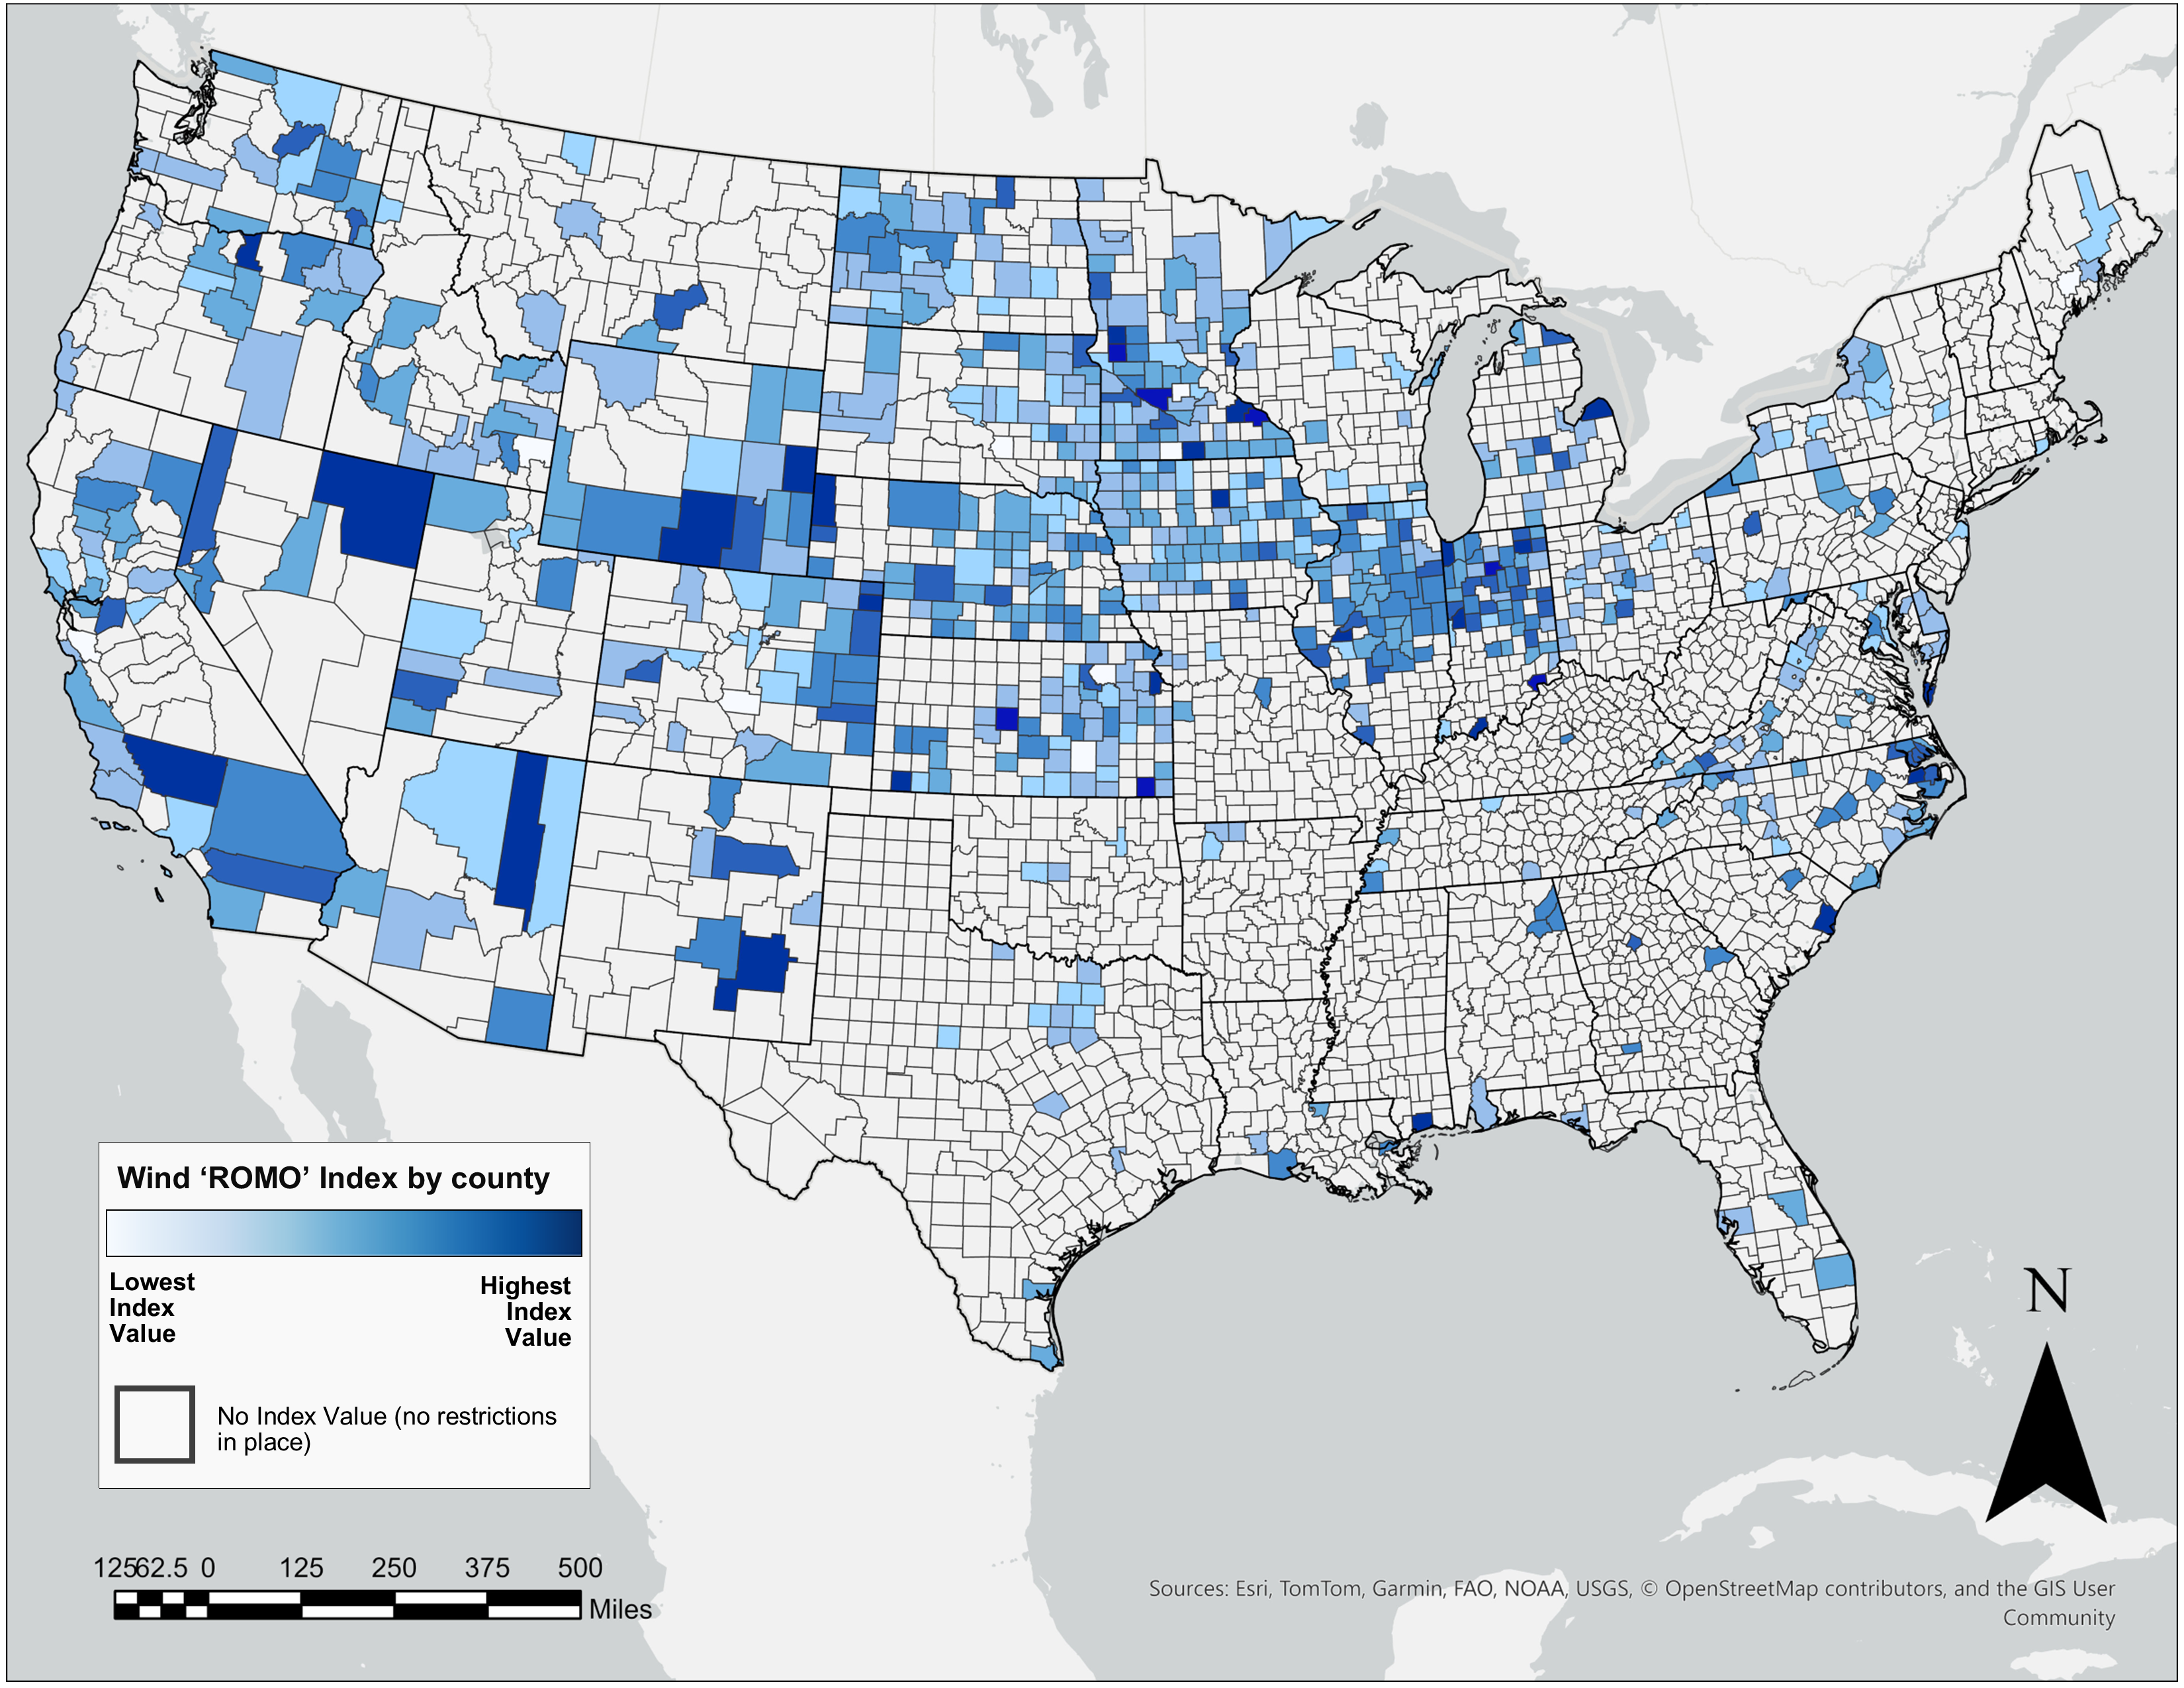
In terms of regions, wind restrictions remain common across the Midwest, Great Plains, and the Southwest (see map below). We identified this trend in our original report, and recent developments have consolidated it. Since 2023, the states where we have seen the biggest changes in terms of counties with new ordinances are Minnesota (9), Kansas (7), Colorado (6), Indiana (6), and Nebraska (6).
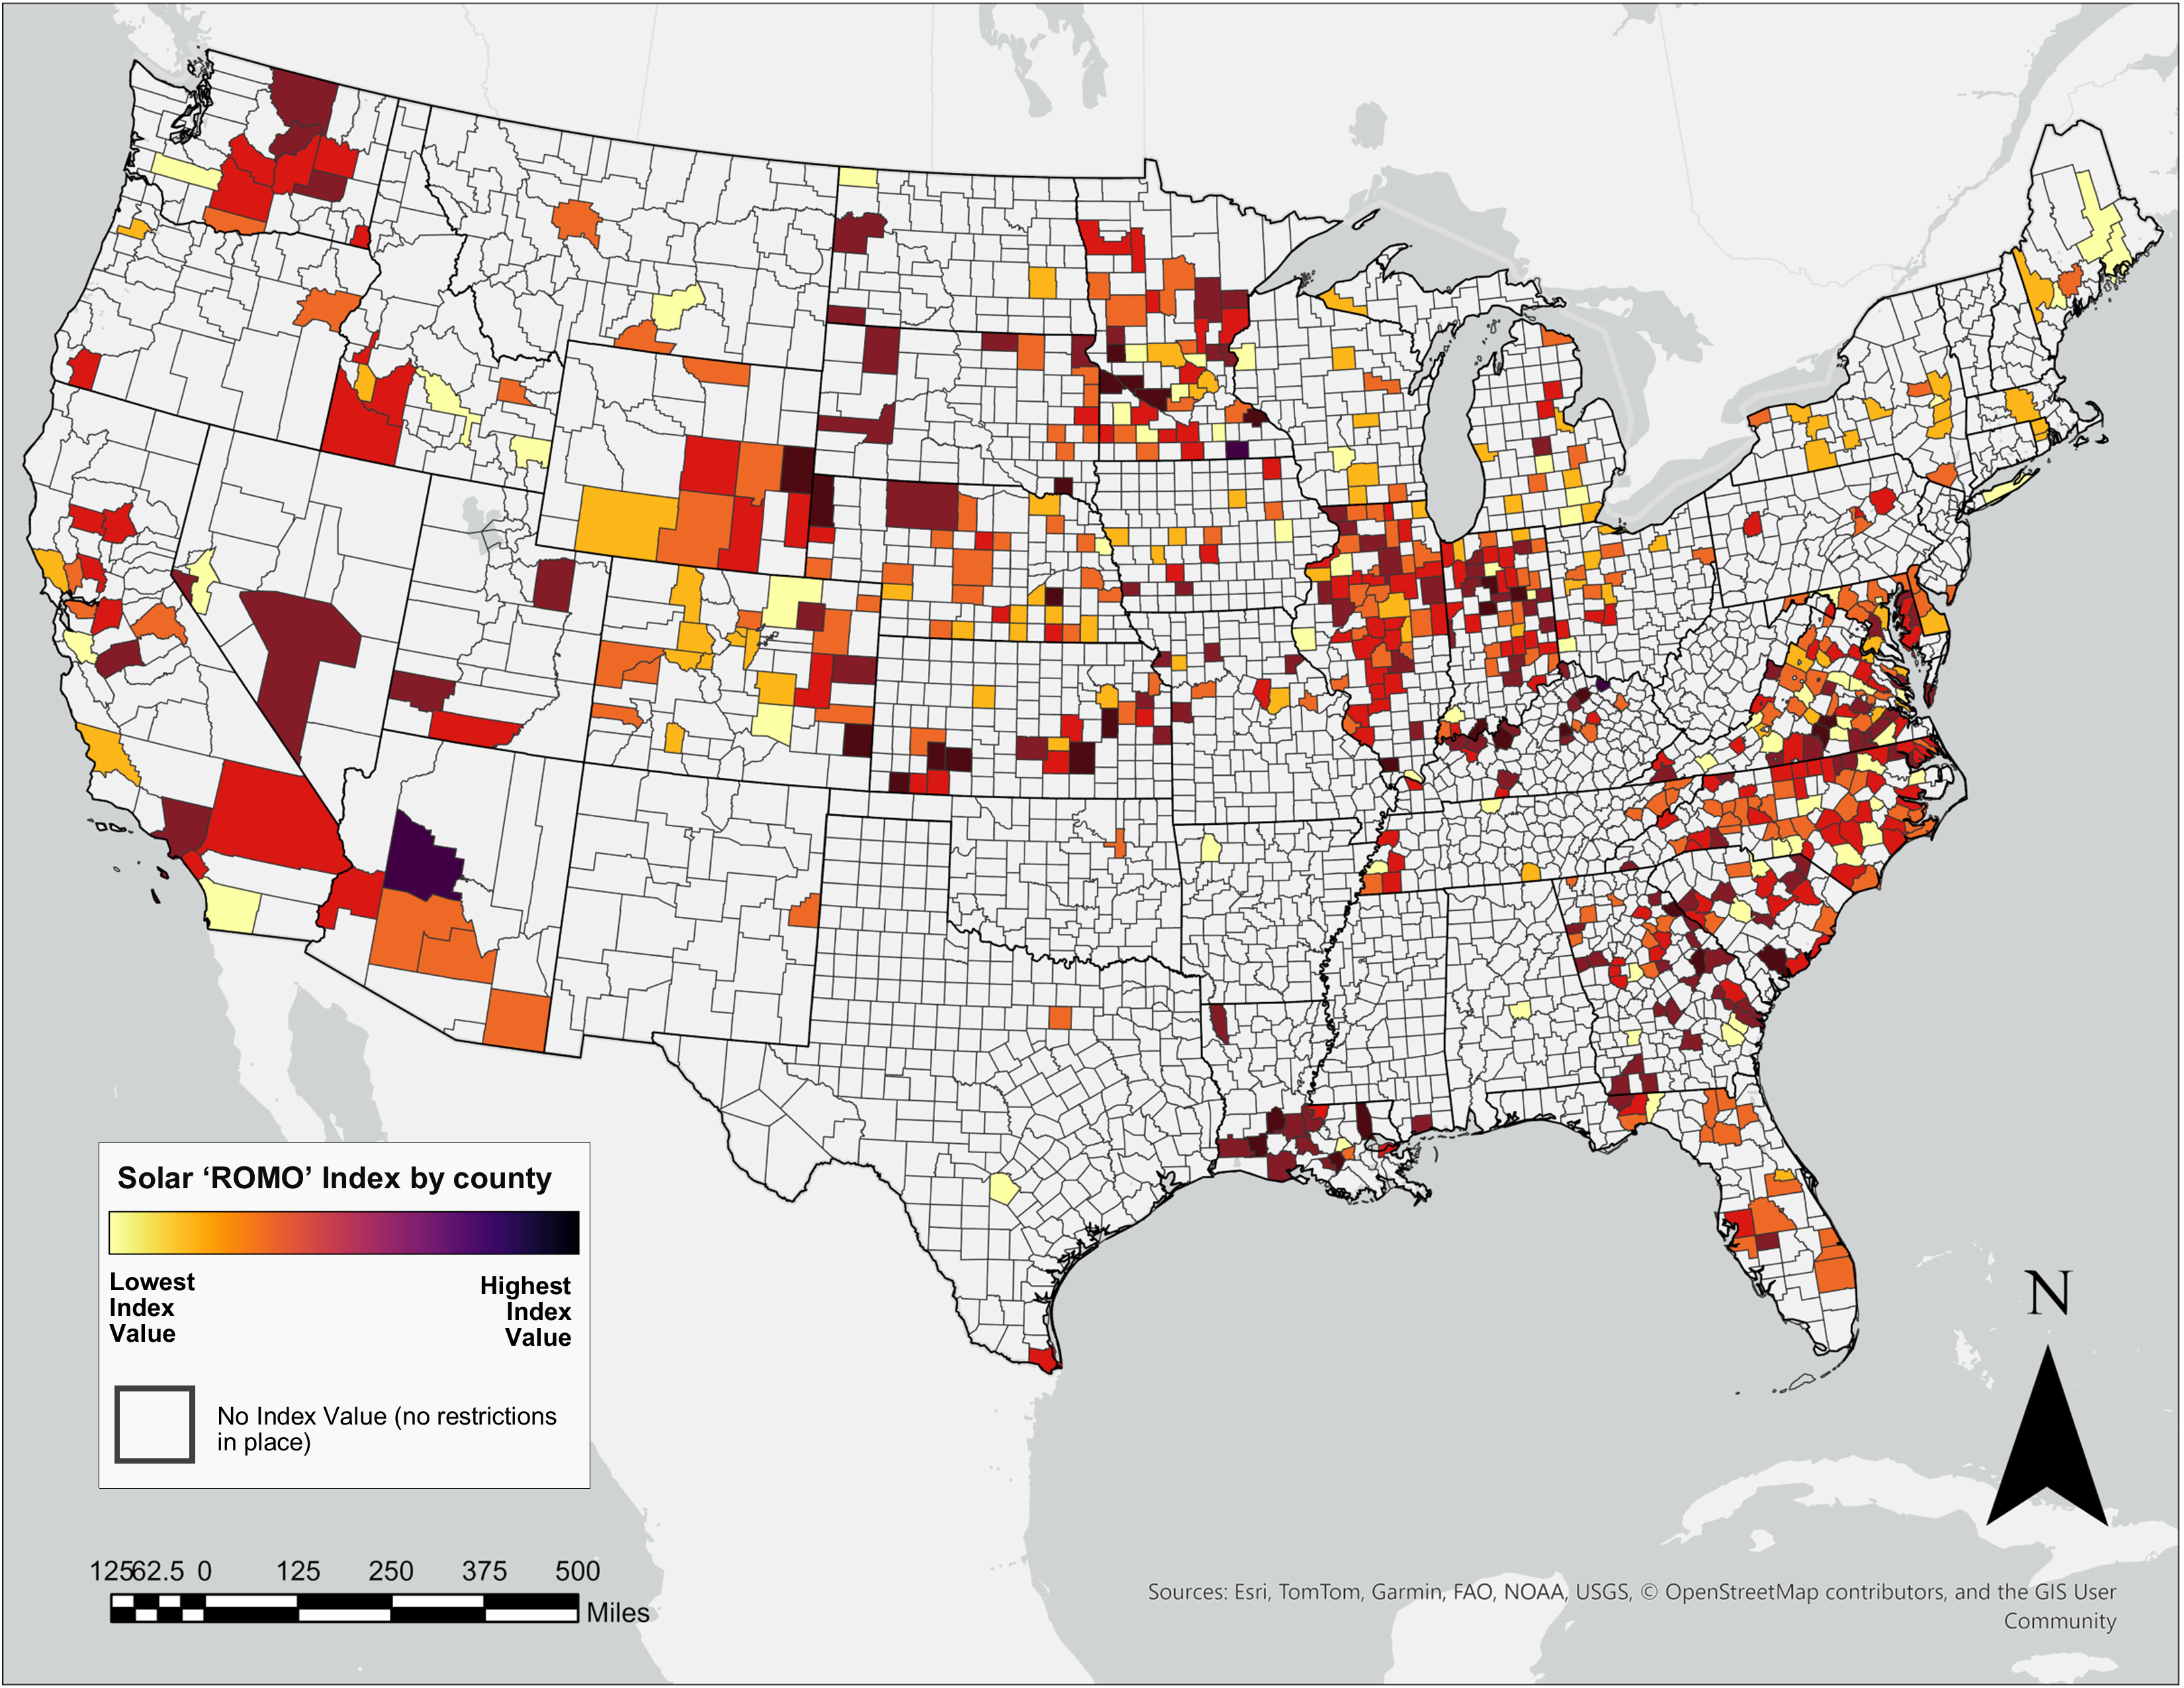
The solar landscape (see map below) also looks somewhat similar to our 2024 report. Counties with anti-solar ordinances are still highly concentrated in the Southeast and Mid-Atlantic, along with large numbers in the Midwest and Southwest. However, solar has seen a much steeper increase than wind: Since 2023, the states that have seen the biggest increases in counties with new ordinances are Minnesota (12), Georgia (11), Virginia (10), Colorado (9), Indiana (8), Nebraska (8), Illinois (7), and Louisiana (7).
These numbers, however, must be understood in context. For example, the numbers above show that many counties in Minnesota seem to be imposing onerous barriers to clean energy development. This is only partially true. After the passage of the IRA in 2022, many predominantly rural counties embarked on a push to regulate renewable development. Concomitantly, Minnesota passed legislation in 2024 to consolidate the state review of large wind and solar energy infrastructure projects under the Minnesota Public Utilities Commission (PUC) in order to streamline siting decision-making by unifying authority of environmental reviews (formerly done by the Department of Commerce) and permitting. Although it’s too early to tell, the expectation is that this process would reduce roadblocks by removing the need for interagency coordination. When understanding how county ordinances may impact final siting decisions, state-level policies must be taken into account.
Although it is hard to speculate if (and to what extent) the IRA created the conditions for the development of pro- or anti-renewable ordinances, pro- or anti-renewable state legislation, both, or neither, it is clear that institutional changes in the siting landscape took place at multiple levels. We had already observed a similar institutional response in Illinois (HB 4412/Public Act 102-1123), where the state passed comprehensive siting legislation in 2023.
The transition to a carbon-free economy is undergoing a turbulent moment. Although it will generate enormous benefits and opportunities, it will also produce significant costs, particularly for those communities that have built their economies around fossil fuels and for those who need to coexist with newly built clean energy infrastructure.
To be sure, the point of this analysis is not to criticize all local restrictions on renewable energy development — a position that, for example, some in the Abundance Liberalism movement may embrace. Rather, what is called for are policies that strike a constructive balance between development and reasonable countervailing concerns regarding safety and other public welfare interests. Our ROMO index is designed to isolate and highlight these important tradeoffs.
The best way to develop better regulations to oversee renewable energy development is through a democratic process that is truly responsive, inclusive, and meaningful. For this process to succeed (particularly consistent with Abundance Liberals’ concerns about undue delays to infrastructure buildout and inefficient implementation of public policy), developers scouting potential sites would need to engage in early and open communication with communities, long before planning documents are submitted to county approval boards. As we noted as part of our earlier analysis, empirical research and discrete case studies suggest that most of the anti-renewable energy ordinances are not the product of such a democratic process.
A more equitable and democratic siting process is certainly possible and it has been mandated (albeit partially) in some cases, at the state and federal levels. Critically, ensuring this depends on a responsive and capable public sector.
At the federal level, a better implementation of what the Department of Energy (DOE) did with loans and other forms of financial backing/incentives could also be the way to go: if you want the money, you need to respect X, Y, and Z.
For example, during the Biden administration, DOE required evidence that concrete steps had been taken toward a potential community benefits agreement (CBA) in order to secure funding. What would happen next was left to be determined.
In a conversation with DOE officials, we learned the agency was apprehensive about withholding funds from developers, for example, as a form of punishment for not meeting the CBA-related steps, since the main policy goal was to get the money out for renewable development.
This update represents another step in our efforts to maximize information access and ensure the clean energy transition not only happens, but that it does so consistent with just transition and energy democracy principles.
Methodological notes
Our dataset consists of every local ordinance we were able to identify, review, and manually code. We decided to avoid relying on generative AI for this update, understanding that human coding remains the gold-standard in converting sometimes complex combinations of parameters (setbacks, features, land uses) into machine readable numerical variables. We are aware of at least one other comprehensive dataset published on February 3, 2026, by the National Laboratory of the Rockies (the former National Renewable Energy Laboratory), but that dataset was collected with the help of generative AI, which is prone to mistakes. Since we were unable to validate these data, we decided to avoid using them.
An additional clarification is warranted when comparing this update with our Communities Left Behind report. Although our previous analysis captured the law of the land circa May 2023, this updated database goes beyond our previous efforts because we were able to find more documents that were not available before.
Additionally, there are many cases in which codes of ordinances or comprehensive zoning codes will provide a “last updated” date for the entire code, but not the specific date in which a given section or ordinance was last updated. This creates a problem where a newly identified ordinance has a “last updated” date of 2023, without further specification of the day it was adopted, as it could temporarily overlap with our previous study. Reporting this hypothetical ordinance as a “change” without further certainty would distort the trends we are trying to observe. Given the time-sensitive nature of these trends and their interaction with federal-level dynamics like the passage of the IRA and the election of Donald Trump, we decided to report as time-sensitive changes those ordinances that were put in place on or after January 1, 2024.
Finally, it is likely that we didn’t capture the entire universe of existing ordinances due to issues of availability and access. This is particularly salient in the case of municipal ordinances. However, our effort still represents one of the most complete (and freely available) datasets in existence.
Update: On March 2, 2026, we updated this article to add more precise information about energy permitting and environmental review legislation that Minnesota passed in 2024.